Istio: Sporadic 503 Error
Sep 11, 2021
Random 503 Errors
Using Istio service mesh in production, I’ve often come across error logs from the istio-proxy sidecar that reports an observation of 503 errors with the response flags “UC”:
{"path":"/server/io-bound/50","protocol":"HTTP/1.1","request_id":"110677bb-7cc8-495c-8872-784e59ba8904","method":"GET","duration":"28","response_code":"503","upstream_host":"127.0.0.1:8080","bytes_sent":"95","response_flags":"UC","route_name":"default"}
From the envoy documentation, the response flag “UC” means:
UC: Upstream connection termination in addition to 503 response code.
Furthermore, the errors are very rare, occuring once every 30 minutes under constant 100+ requests per second. The errors spikes to 5 to 10 occurences under high load of 700+ requests per second.
What’s more puzzling is the fact that while the proxy reports a 503 response code, none of the client has actually observe said error from their perspectives. Though it has not affect us in any way in terms of performance, I am very intrigued and generally not comfortable with brushing off these errors as it might cause a big problem down the road. Therefore, I’ve read up great discussion and blogposts online to make sense out of it.
In this article, I’ll share what I have find out as well as some of the findings I have.
Upstream, Downstream?
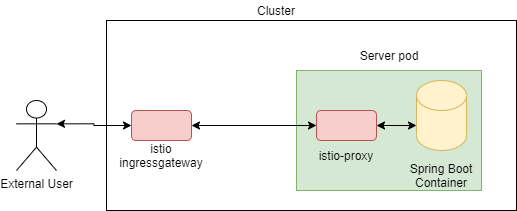
Before we look further into the error, it’s vital to have a firm grasp on the term “upstream” and “downstream” in the context of network connection. Without this understanding, it’s very difficult to figure out who is causing the error as the error message and documentation are using these terms a lot. To put it simply, the request caller is the “downstream” and the request processor is the “upstream”. The confusion arises when the same component can be either an “upstream” or “downstream”, depending on the perspective. Let’s say we have a simple service mesh with a single Spring boot webapp as our microservice. Figuratively, it would look like:

Figure 1: A simple service mesh with a single workload “server”
From the layout, we can see that there are 3 distinct connections:
- between external user to istio ingressgateway
- between istio ingressgateway to istio-proxy
- between istio-proxy to Spring Boot container
Using the definition earlier, we can easily make out the upstream and downstream component on each connection:
- In this connection, external user is the downstream as it’s making the request. Whereas istio ingressgateway is the upstream as it’s receiving/serving the request made.
- In this connection, istio ingressgateway is now the downstream. This is because it’s actually making a request. Similarly, the istio-proxy is the usptream as it is the receiving side of request.
- In this connection, istio-proxy is now the downstream as it is the party that initiate the request. Spring boot container on the other hand is the upstream as it is the one serving the request.
“Upstream Connection Termination”
By getting a firm grasp of the up and downstream terminology, we can now examine the error message in details. If we look again at the meaning of the “UC” response flag:
UC: Upstream connection termination in addition to 503 response code.
It says that the “upstream” is terminating the connection. Now we know that the log is obtained from the sidecar istio-proxy, hence the upstream here is referring to the microservice it is serving. Concretely, it is saying that our microservice is terminating the connection.
Hypothesis: HTTP/1.1 Pipelining is The Root Cause
One possible explanation for this occurence is due to HTTP/1.1 pipelining mechanism. See, in HTTP/1.1, client can pipeline multiple requests onto the same TCP connection. What this achieve is the reduction in the amount of TCP session creation which would be resource intensive. Exactly how it works is out of the scope of this article but users are encouraged to look up the plentiful resources online that explains this mechanism.
The idea behind this hypothesis is that there’s a possibility that right after the downstream piped a new request, the server is terminating the connection at the same time due to keep alive timeout. In other words, the request has been made by the downstream on a terminated TCP connection.
Frankly speaking, I’ve not come up with this hypothesis myself. In fact, I’ve gotten the idea from this blog post here. The contribution of this article is to convince you (and myself) that it is indeed the case, through a simple empirical experiment.
Experiment
To verify the hypothesis, we can devise and conduct a simple experiment.
Firstly, we refine our hypothesis to:
The shorter the TCP connection is allowed to keep alived, the more 503 errors will be observed
That’s because when we reduce the amount of time the TCP connection is allowed to keep alive, we can increase the chance of connection termination by upstream. As a result, we should observe more 503 errors. Of course, the reverse is true as well.
For Spring Boot webapp that uses embedded Tomcat, we can configure this timeout using the properties server.tomcat.keep-alive-timeout.
Control Variable
In this experiment, the control variable is the TCP keep-alive timeout value. Concretely, it’s how long each TCP connection is allowed to keep alive, in milliseconds.
Experiment Set Up
The set up consists of the following components:
- A
k3dcluster - Istio service mesh within the cluster
- A Spring Boot webapp as a microservice
- A Envoyfilter applied onto the cluster to enable access log for request-response pair that has 5XX status code.
ksniff- A kubernetes plugin to sniff packets on a container and pipe to Wireshark for analyzing.hey- A program to simulate client requests
Firstly, we’ll create the k3d cluster and deploy Istio onto the cluster. Then, we’ll deploy our Spring Boot webapp and have the istio-proxy sidecar injected. Next, we’ll run the ksniff to start capturing packets on the istio-proxy sidecar that runs alongside Spring Boot Webapp.
Finally, we simulate the downstream requests using the hey program.
Results
| Number of Concurrent Requests | Duration (s) | Keep Alive Timeout (ms) | 503 Observed |
|---|---|---|---|
| 300 | 10 | 5 | 76 |
| 300 | 10 | 100 | 51 |
| 300 | 10 | 1000 | 0 |
Table 1: The number of 503 errors observed against the keep alive timeout (ms)
As we can see, as we increase the longevity of each TCP keep alive timeout, we observe fewer 503 throughout the 10 seconds experiment duration. In the experiment, when we set the keep alive timeout to 1 second (1000 ms), we observe no 503 errors. This is of course due to the probabilistic nature of the occurence, which might shows 503 errors when the experiment is allowed to run longer.
Inspecting a 503 TCP Stream
The result of the experiment is enough to validate the hypothesis. However, I am still not satisfied. Particularly, I am interested in what’s happening at the TCP level when this error happens. To do that, we use ksniff to capture all the network packets during the experiment. Then, we can see the exact error on the network packets using Wireshark in order to solidify our understanding about the theory.
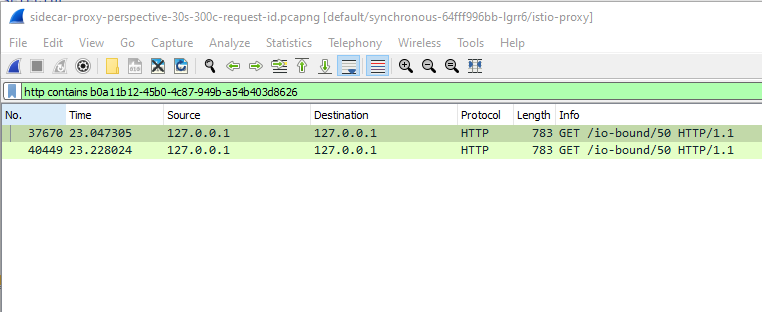
Firstly, we select one of the error log and obtain the value of x-request-id. Then, we can apply the display filter http contains <x-request-id> on Wireshark.
For instance, let’s inspect the packets for request with x-request-id: b0a11b12-45b0-4c87-949b-a54b403d8626:
Figure 2: Applying wireshark display filter
From the figure, we are seeing 2 requests with the same x-request-id. It’s because Istio by default has a retry policy of 2 attemps. For now we’ll just put aside the default retry policy, and we’ll revisit it in the subsequent section.
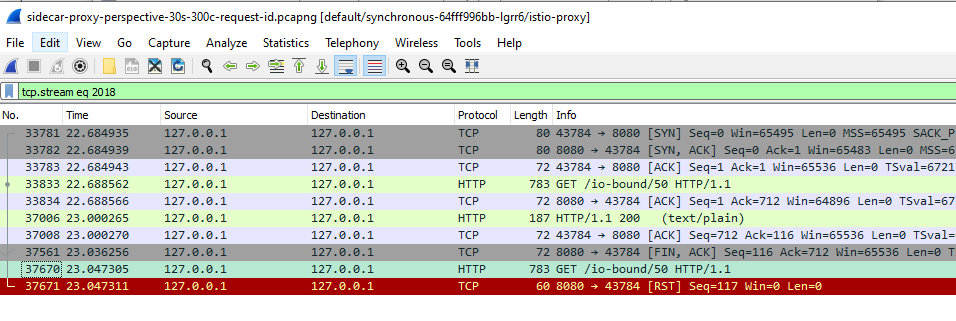
Now, right click on the first match and select “Follow” -> “Follow TCP Stream”. Then we’ll be presented with a sequence of packets that are of the TCP stream that consists this request:
Figure 3: Following TCP stream
One thing to note here is that since the sidecar and webapp is communicating on localhost loop, that’s why we’ll see that the source and destination IP are the same - 127.0.0.1. Hence, we would need to identify the direction of the packet using the source and destination port.
From the TCP stream, we can see that right before the upstream (port 8080) send the RST to downstream (port 43784), the downstream has actually sent a request GET /io-bound/50 HTTP/1.1 to the upstream. Since the downstream receive a RST packet from the upstream before it get the HTTP response, it will consider this as an error and it’s caused by “upstream terminating connection” before the response is received.
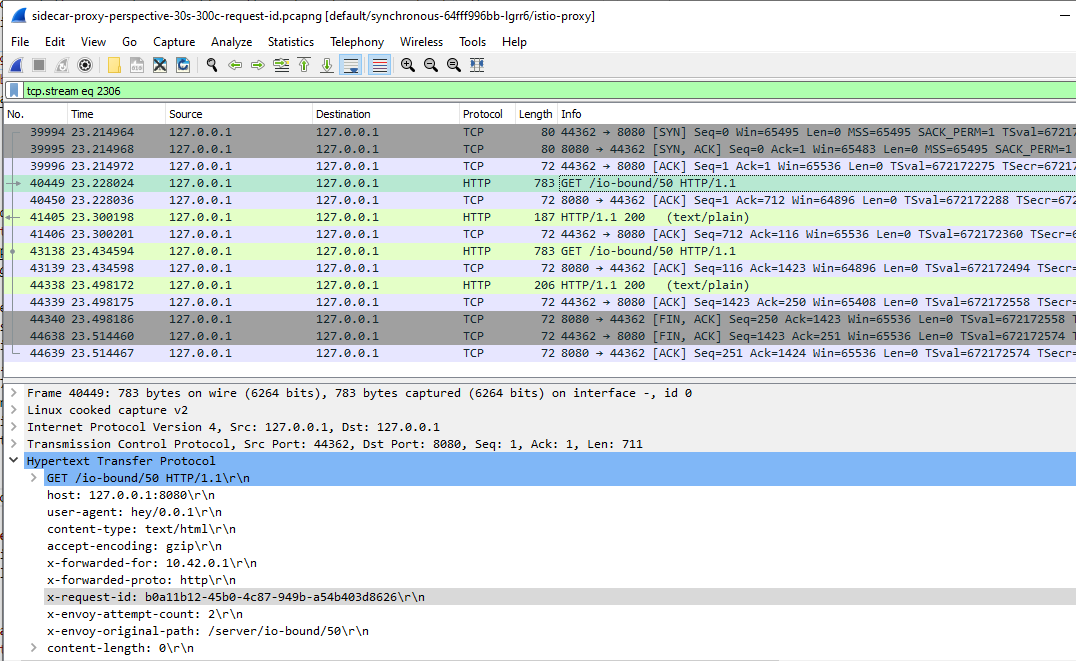
Now, because of the default retry policy, the istio-proxy will attempt the request again through a new TCP connection. If we follow the TCP stream of the 2nd matched packet, we would get the following stream:
Figure 4: TCP Stream of the 2nd attempt.
As we can see, istio-proxy is attempting the request with the same x-request-id again. Except, this time it succeeded in getting a response before the upstream terminates the connection through the RST packet. The stream also continues to serve another HTTP request before it gracefully expire the TCP session using the FIN packet.
But The Client Never Observes 503 Errors?
Although we see istio-proxy reporting 503 errors, there’s no such errors reported from the client perspective. In other words, the 503 errors didn’t propagate to the clients. To explain this behavior, we’ll need to look into the default retry policy on Istio virtual service.
Istio Retry Default
From the Istio documentation, we can see that Istio by default configures a 2 retry attempts for all the virtual services. In other words, when the istio-proxy fails to relay the request to our webapp, it will retry for at least 2 times before it conclude the request has failed with 503 errors.
Additionally, the chance the 503 errors will propagate to the client is extremely small, as it would be highly unlikely that 3 consecutive attemps is hit by the same issue. Therefore, even with the large amount of 503 errors reported by proxy, there’s no 503 observed from the perspective of client.
In fact, this retry behavior on upstream terminating connection is clearly defined in the HTTP/1.1 specification. In the section 8.2.4, it says that “the client should retry the request on server prematurely closing the TCP session”.
Disabling Default Retry - Proving The Point
Of course, we can disable the default retry explicitly on VirtualService to prove the point. Concretely, for the route to our webapp, we can set the retry attempt to 0:
- match:
    - uri:
        prefix: "/server/"
    rewrite:
        uri: "/"
    route:
    - destination:
        host: synchronous.default.svc.cluster.local
    retries:
        attempts: 0
With this configuration, rerunning our experiment with keep-alive timeout set to 5 milliseconds, we would start seeing 503 from the perspective of client.
Conclusion
Although we don’t see much problem having these occasionally 503 errors observed in the log, we can alleviate the issue by increasing the keep-alive timeout to a higher value to reduce the probability the upstream is terminating a connection after a new request is piped on the same session.
Furthermore, we could also switch to HTTP/2 protocol to alleviate this issue, as the connection is persistent.


